
Free guide
Protect What You Have Built!Your Fields Are Real. Your Wealth Should Be Too.
You're a farmer, so you already understand the value of real assets — but what about your savings?
This free, farmer-focused guide reveals:
- Why gold is trusted by landowners
- How UK gold coins can be 100% Capital Gains Tax–free
- The hidden risks of keeping wealth in the bank
- How to start with just £2,000 — no pressure, no jargon
Simply fill in the form to get instant access to your copy.
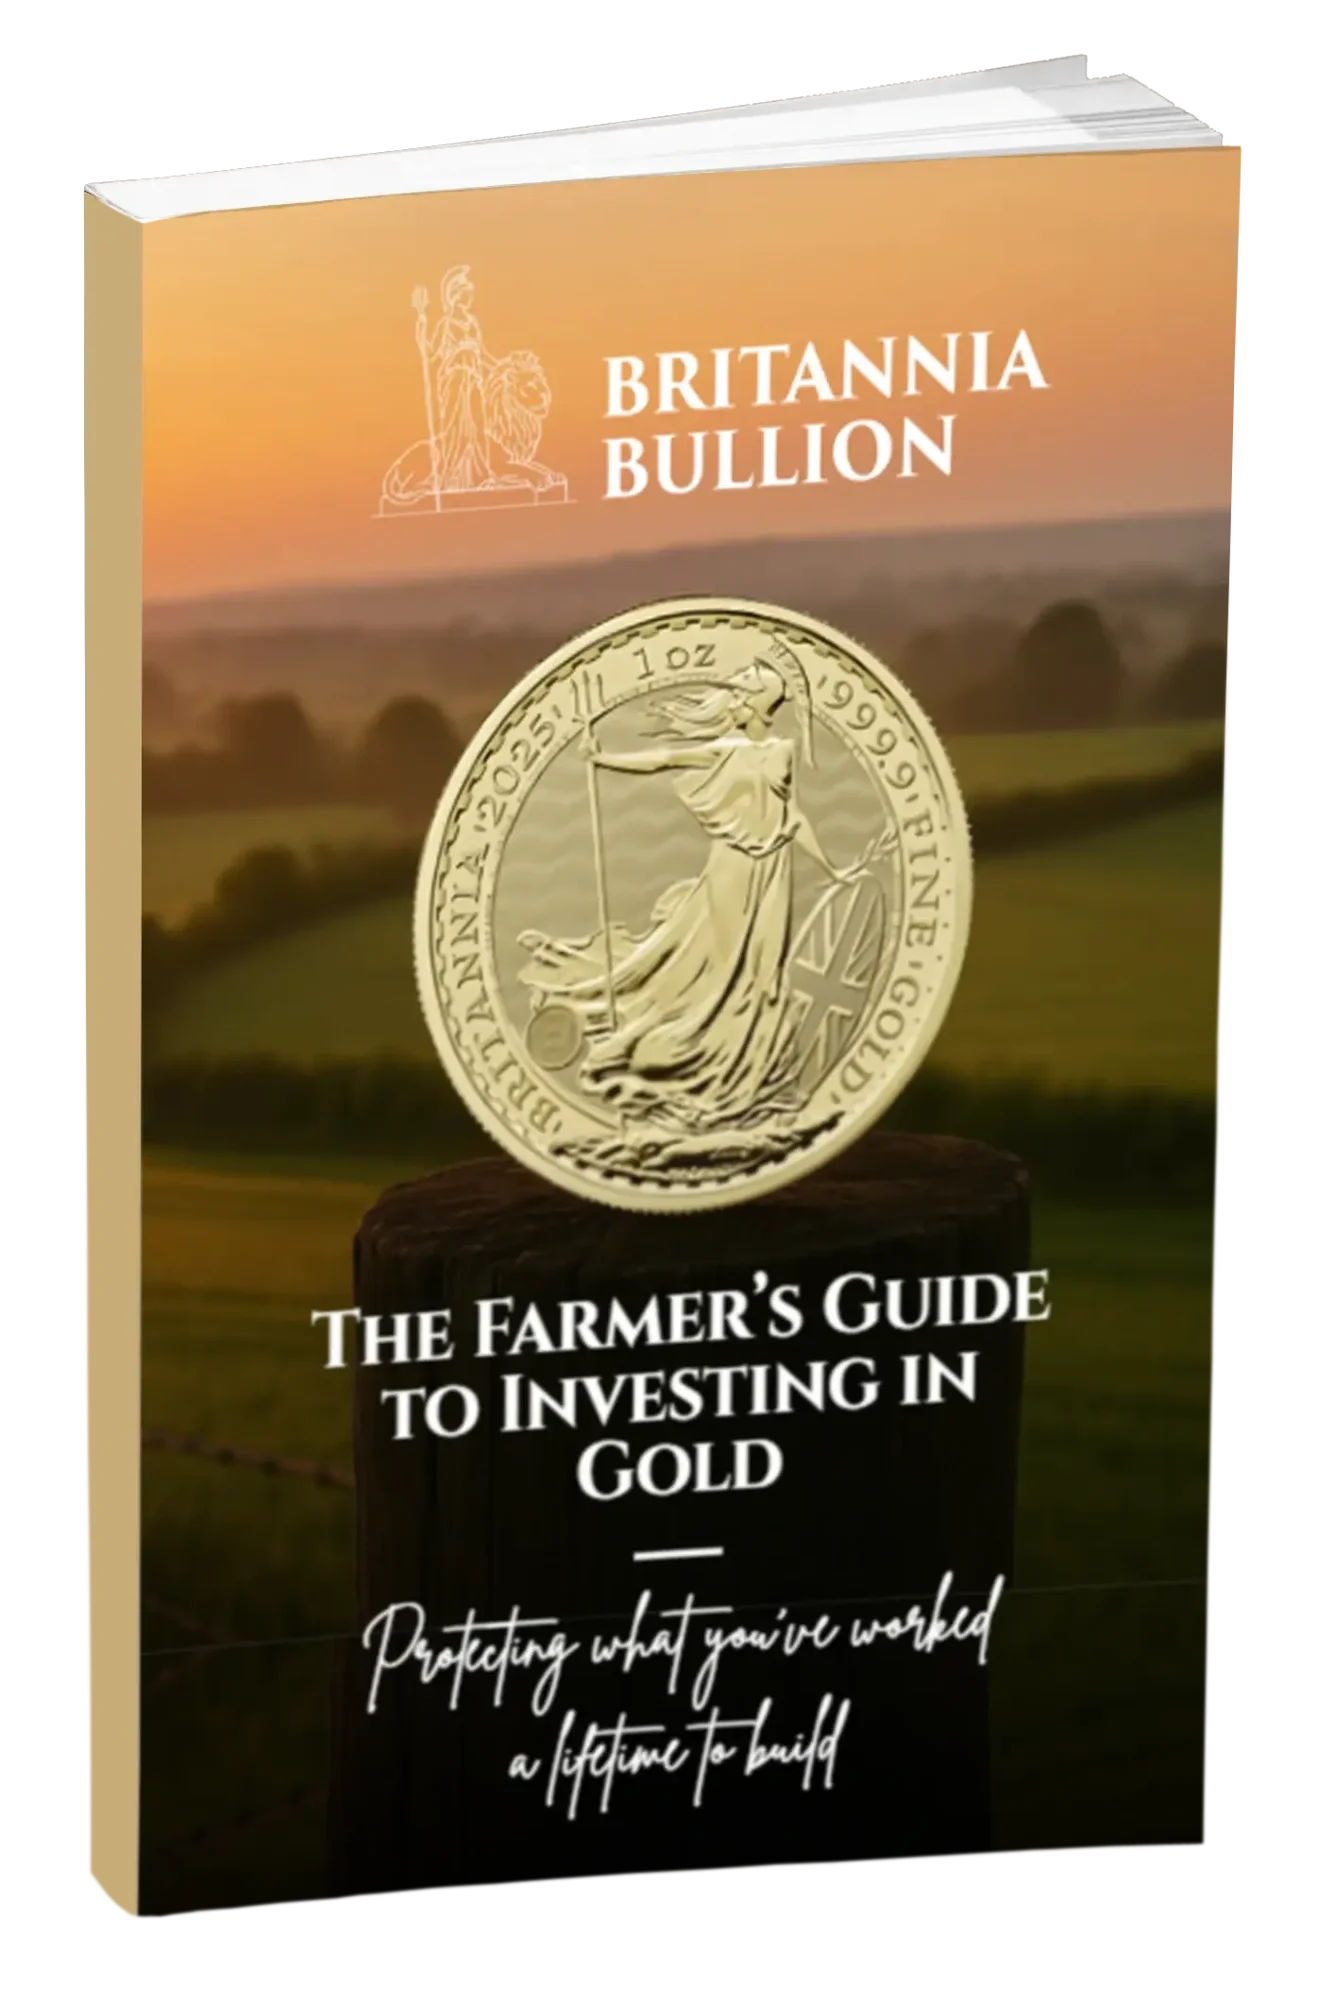
Get my copy
Complete the form and the guide arrives in your inbox straight away.
The long view
If you had put £10,000 away in 2000.
Three British farmers. Same starting pot. One bought gold bullion. One bought the FTSE 100. One left it in the bank. Twenty five years later, here is what each pot is worth, in nominal pounds.
Chart 01 — Cumulative value
Source: LBMA gold price (GBP), FTSE 100 TR, Bank of England Bank Rate
£10,000 invested at the start of 2000
Nominal GBP value, year end. FTSE 100 includes reinvested dividends. Cash accrues Bank Rate, no fees.
- Gold (GBP)
- FTSE 100 total return
- Cash (UK Bank Rate)
Takeaway
Gold turned £10,000 into roughly £193,000 over twenty five years. The FTSE 100 with dividends reinvested grew it to about £33,000. Cash, even earning interest, struggled to keep pace.
- +1,075%
- Gold's own return, 2000 – 2025
- +232%
- FTSE 100 total return, 2000 – 2025
- +116%
- UK inflation, 2000 – 2025
- £0.46
- What a year 2000 pound buys today
Purchasing power
The quiet leak: cash under the mattress.
A pound saved is not always a pound earned. Each year inflation lifts the cost of fuel, feed, fertiliser and groceries. The note in your pocket does not change, but what it buys gets smaller. Here is the same £10,000, in real purchasing power.
Chart 02 — Real purchasing power
Source: ONS Consumer Price Index (composite), LBMA gold price
£10,000 in 2000, adjusted for UK inflation
Cash held outside the banking system loses real value one on one. Gold has historically tracked, then outpaced, the cost of living.
- Gold (real value)
- FTSE 100 (real value)
- Cash at home, no interest
Takeaway
Cash kept off the grid in 2000 has lost more than half its buying power. The same £10,000 in gold has multiplied its real world value several times over.
Crisis performance
When the markets shake.
A safe asset earns its name not in the calm years but in the rough ones. Across the four biggest market shocks of the last twenty five years, here is how gold and the FTSE 100 compare, in pounds, during the worst of it.
Chart 03 — Crisis performance
Source: LBMA, FTSE Russell, Bloomberg historical data
Returns during major market downturns (GBP)
Sterling total return during the two most severe equity drawdowns since 2000.
- Gold (GBP)
- FTSE 100
Takeaway
In every one of the last quarter century's major market shocks, gold posted positive sterling returns while the FTSE 100 fell. It is the textbook definition of a counter-cyclical asset.
Annual returns
A year by year ledger.
Gold does not rise in a straight line. Some years it falls. The point is what happens across a working lifetime. Here is every year of gold's sterling performance since 2000, set against the FTSE 100.
Chart 04 — Annual returns
Source: LBMA gold price in GBP, FTSE 100 total return index
Year on year returns, gold vs FTSE 100
Annual percentage change, in pounds sterling. Negative bars are losing years.
- Gold (GBP)
- FTSE 100 total return
Takeaway
Gold has outperformed the FTSE 100 in roughly two thirds of the last twenty five calendar years. It has had losing years, but its compound trajectory is upward.
Maximum drawdown
Worst case scenarios.
Risk is not just about average returns. It is about how far things can fall, and for how long. Here is the maximum drawdown, the deepest valley from any peak, for each asset class over the period.
Chart 05 — Maximum drawdown
Source: LBMA, FTSE Russell, ONS, Bank of England
Largest peak-to-trough fall, 2000 – 2025
The deepest paper loss an investor would have endured had they bought in at the worst possible moment.
- Gold (GBP)
- Cash and equities
Takeaway
Gold's worst stretch was a nominal fall of about a third, and it fully recovered. Equities suffered a near 50% drop in the financial crisis. Gold's worst sustained fall was milder, and recovered.
Disclaimer: This material is provided for general information purposes only and should not be regarded as financial, tax or investment advice. Any decisions you make should be based on your own independent research and, where appropriate, professional guidance from a qualified adviser.
The information presented reflects our understanding of the precious metals market, broader economic conditions and relevant legislation at the time of writing. While every effort has been made to ensure accuracy, we cannot guarantee that details remain current or free from error, nor accept responsibility for any loss arising from reliance on this content.
Prices of precious metals may fluctuate significantly, meaning the value of your holdings can fall as well as rise. Our pricing, premiums and fees are subject to change at our discretion, in line with supply, demand and market developments.
We do not provide personalised investment or tax recommendations. If you require tailored advice, please consult a licensed financial or tax professional.